2. Now read the demo master.list.
demo.master.list.path<-system.file("extdata", "BrainMasterList_Symbol.rda", package = "TrendCatcher")
load(demo.master.list.path)
3. Use GO enrichment analysis to construct TimeHeatmap
To draw TimeHeatmap using GO database, please use draw_TimeHeatmap_GO function. This function will return a list composed of a TimeHeatmap plot and a merge.df dataframe. Due to the limited size of TimeHeatmap for visualization, users can play with merge.df which includes all the GO enrichment analysis for each time window.
You can also load the demo TimeHeatmap object to see the what elements it contains. It has 3 elements, a ComplexHeatmap object time.heatmap, a data.frame merge.df and a data.frame GO.df.
# To save time, directely load from extdata
demo.time.heatmap.path<-system.file("extdata", "Brain_TimeHeatmap.rda", package = "TrendCatcher")
load(demo.time.heatmap.path)
names(time_heatmap)
## [1] "time.heatmap" "merge.df" "GO.df"Print out TimeHeatmap from the time_heatmap list object.
require("ComplexHeatmap")
print(time_heatmap$time.heatmap)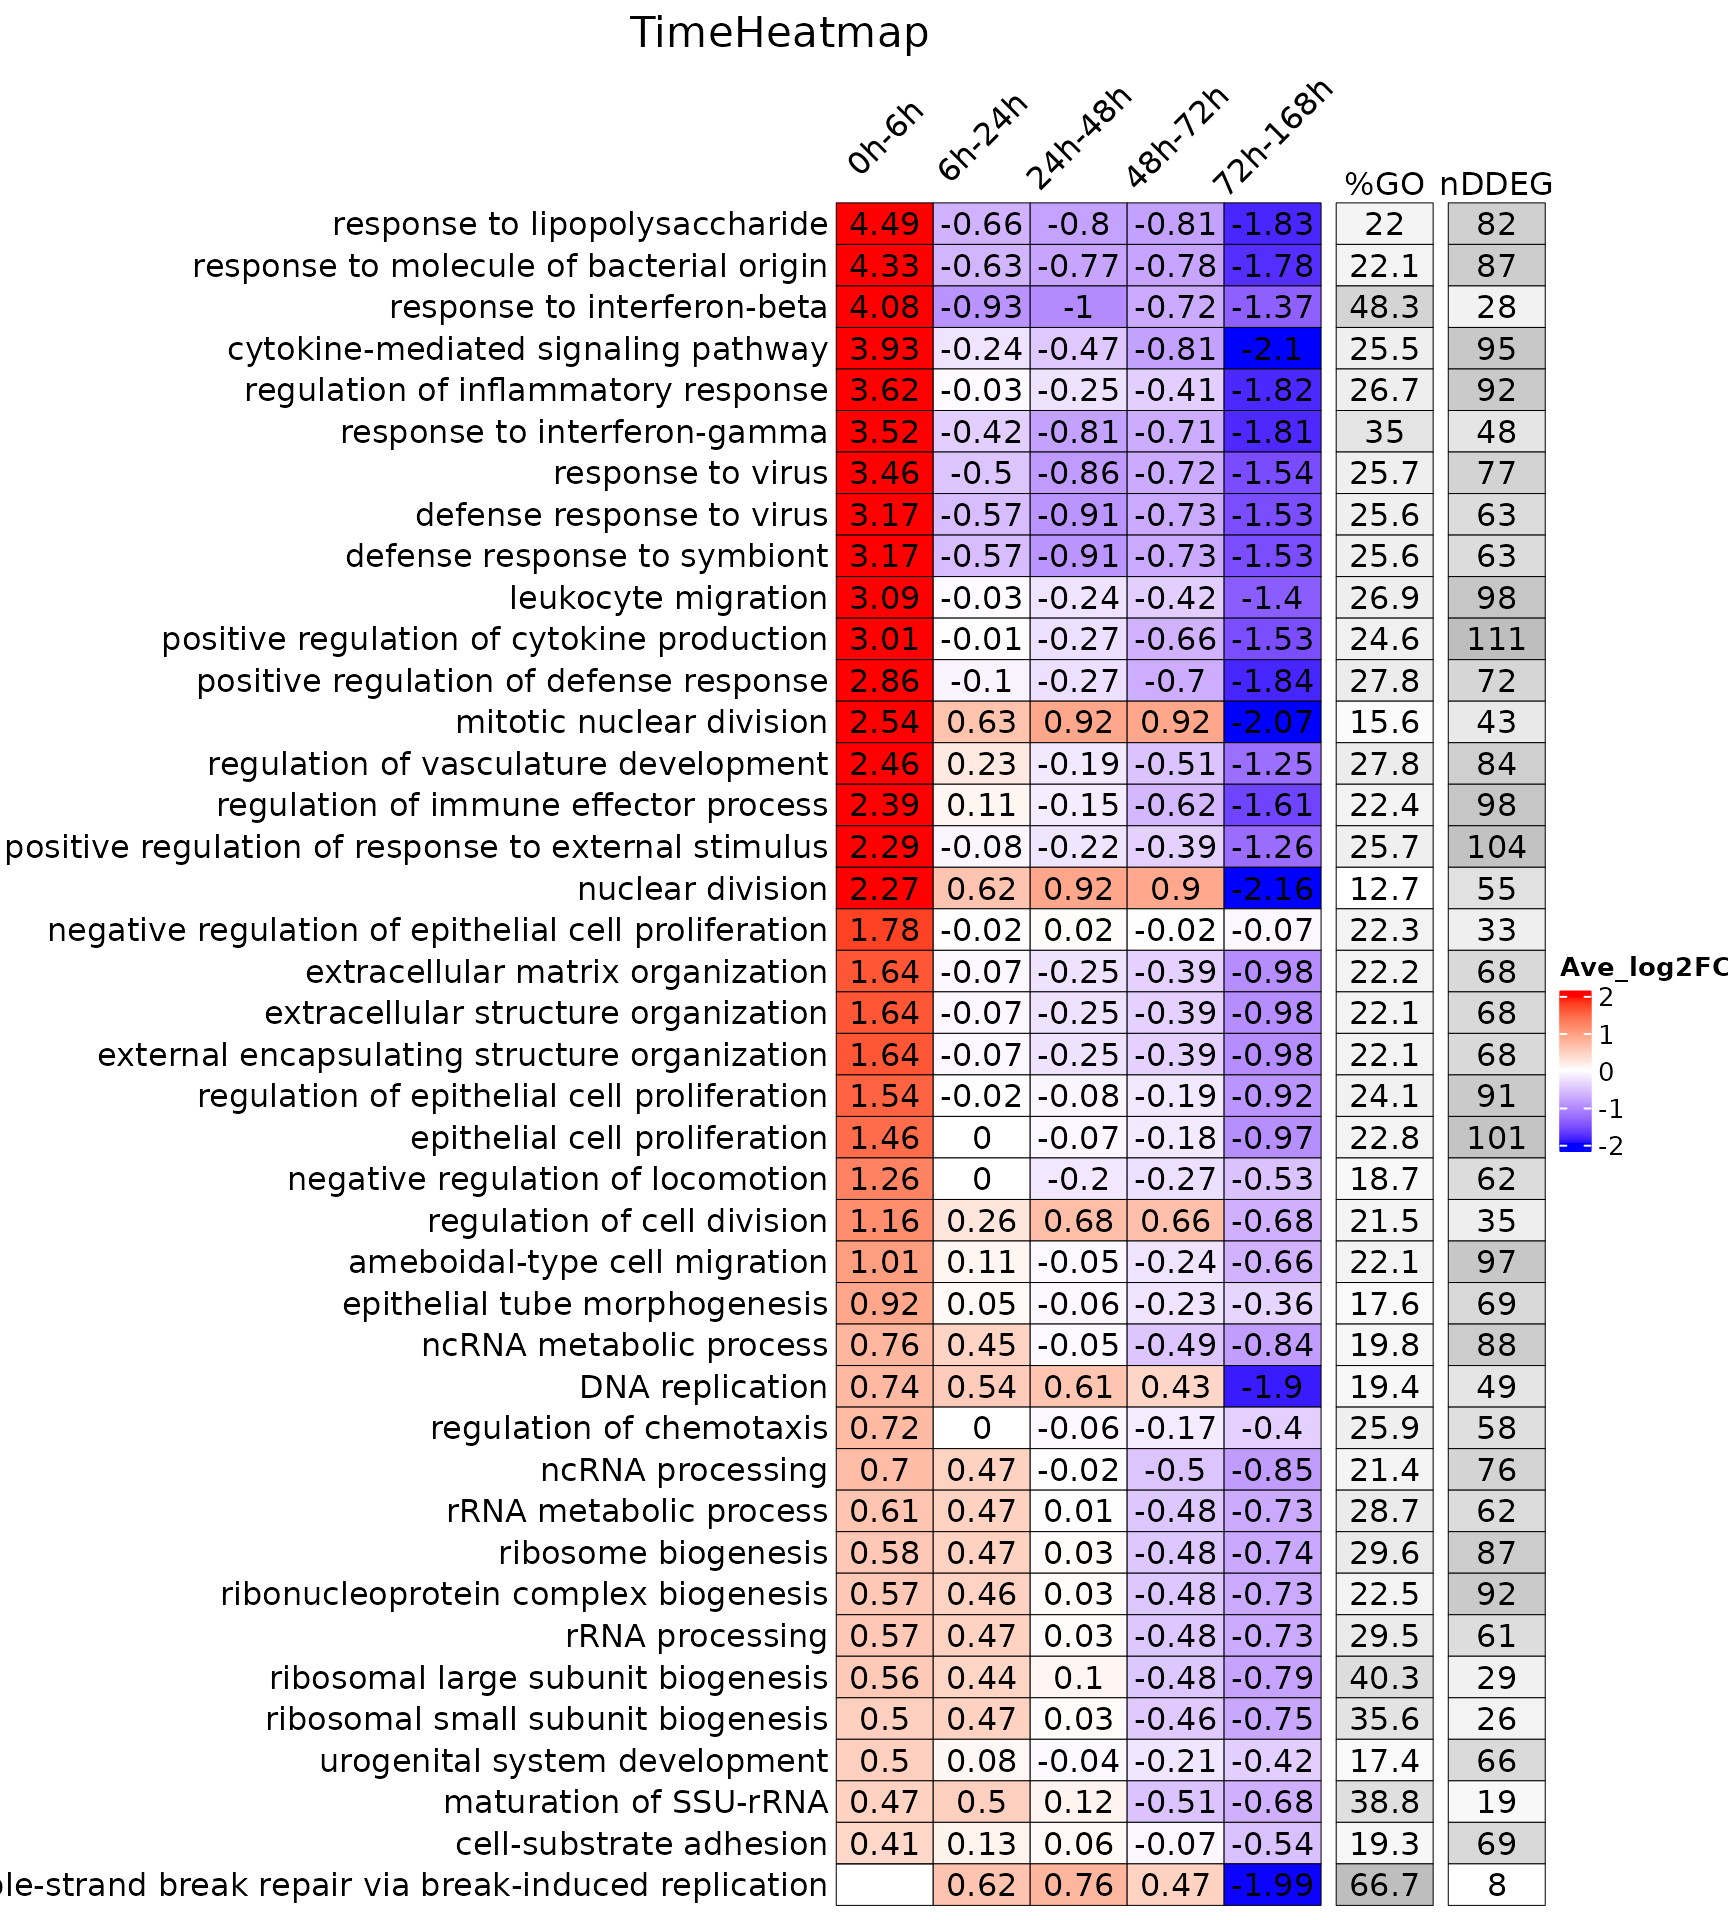
Check all the enriched GO terms.
head(time_heatmap$merge.df[,1:5])## ID Description
## 0h-6h.GO:0042254 GO:0042254 ribosome biogenesis
## 0h-6h.GO:0001819 GO:0001819 positive regulation of cytokine production
## 0h-6h.GO:0022613 GO:0022613 ribonucleoprotein complex biogenesis
## 0h-6h.GO:0019221 GO:0019221 cytokine-mediated signaling pathway
## 0h-6h.GO:0050727 GO:0050727 regulation of inflammatory response
## 0h-6h.GO:0009615 GO:0009615 response to virus
## p.adjust GeneRatio BgRatio
## 0h-6h.GO:0042254 4.797111e-34 84/1268 294/23355
## 0h-6h.GO:0001819 9.136232e-29 97/1268 452/23355
## 0h-6h.GO:0022613 6.541570e-27 89/1268 408/23355
## 0h-6h.GO:0019221 4.570376e-25 82/1268 372/23355
## 0h-6h.GO:0050727 1.076822e-24 78/1268 344/23355
## 0h-6h.GO:0009615 2.417513e-24 72/1268 300/23355Check top enriched GO terms average log2FC within each time window.
head(time_heatmap$GO.df[,1:5])## ID Description t.name direction
## 1 GO:0042254 ribosome biogenesis 0h-6h Activation
## 2 GO:0042254 ribosome biogenesis 6h-24h Activation
## 3 GO:0042254 ribosome biogenesis 24h-48h Activation
## 4 GO:0042254 ribosome biogenesis 48h-72h Deactivation
## 5 GO:0042254 ribosome biogenesis 72h-168h Deactivation
## 6 GO:0001819 positive regulation of cytokine production 0h-6h Activation
## Avg_log2FC
## 1 0.5758218
## 2 0.4704128
## 3 0.0269940
## 4 -0.4836805
## 5 -0.7361026
## 6 3.00765724. TimeHeatmap with non-redundant GO terms.
Sometimes GO terms are redundant, users can select manually non-redundant GOs using function below.
go.terms<-unique(time_heatmap$GO.df$Description)[1:5]
time_heatmap_selGO<-draw_TimeHeatmap_selGO(time_heatmap = time_heatmap, sel.go = go.terms, master.list = master.list, GO.perc.thres = 0, nDDEG.thres = 0, save.tiff.path = NA)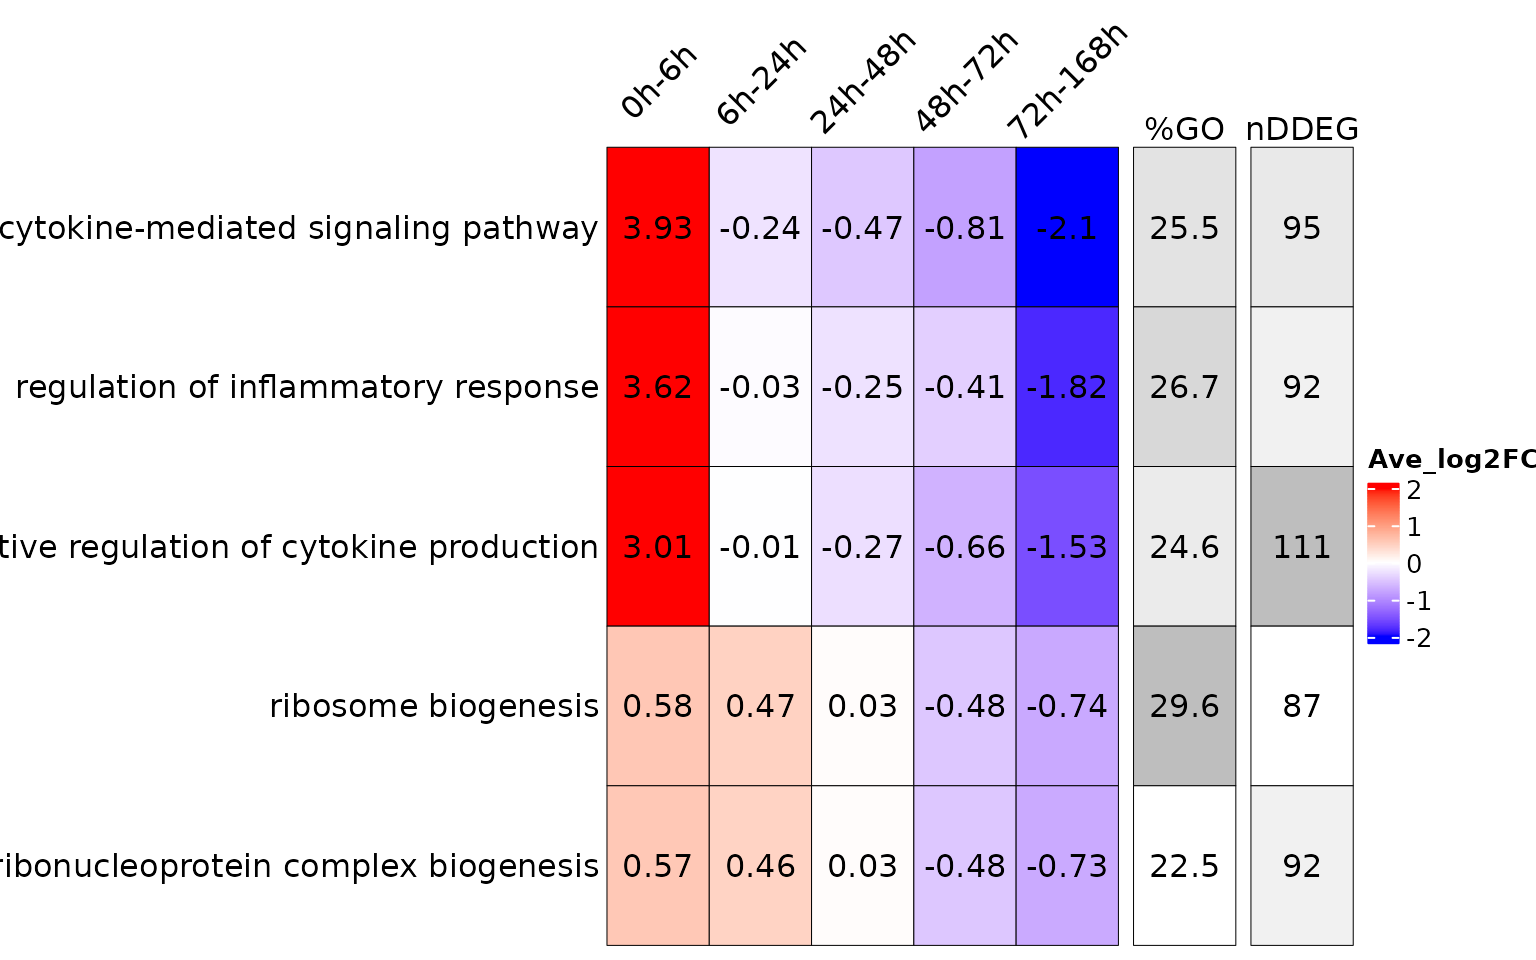
5. Look at Genes candidates from picked enriched GO terms.
To look at which genes are involved within the TimeHeatmap above. We can call draw_GOHeatmap function. This function is useful when one is comparing multiple projects.
go.terms<-c("response to lipopolysaccharide",
            "response to interferon-beta",
            "cytokine-mediated signaling pathway",
            "response to interferon-gamma",
            "response to virus",
            "leukocyte migration",
            "mitotic nuclear division",
            "regulation of vasculature development",
            "extracellular structure organization",
            "regulation of epithelial cell proliferation")
gene.GO.df<-draw_GOHeatmap(master.list = master.list, time.window = "0h-6h",
                           go.terms = go.terms,  merge.df = time_heatmap$merge.df,
                           logFC.thres = 5)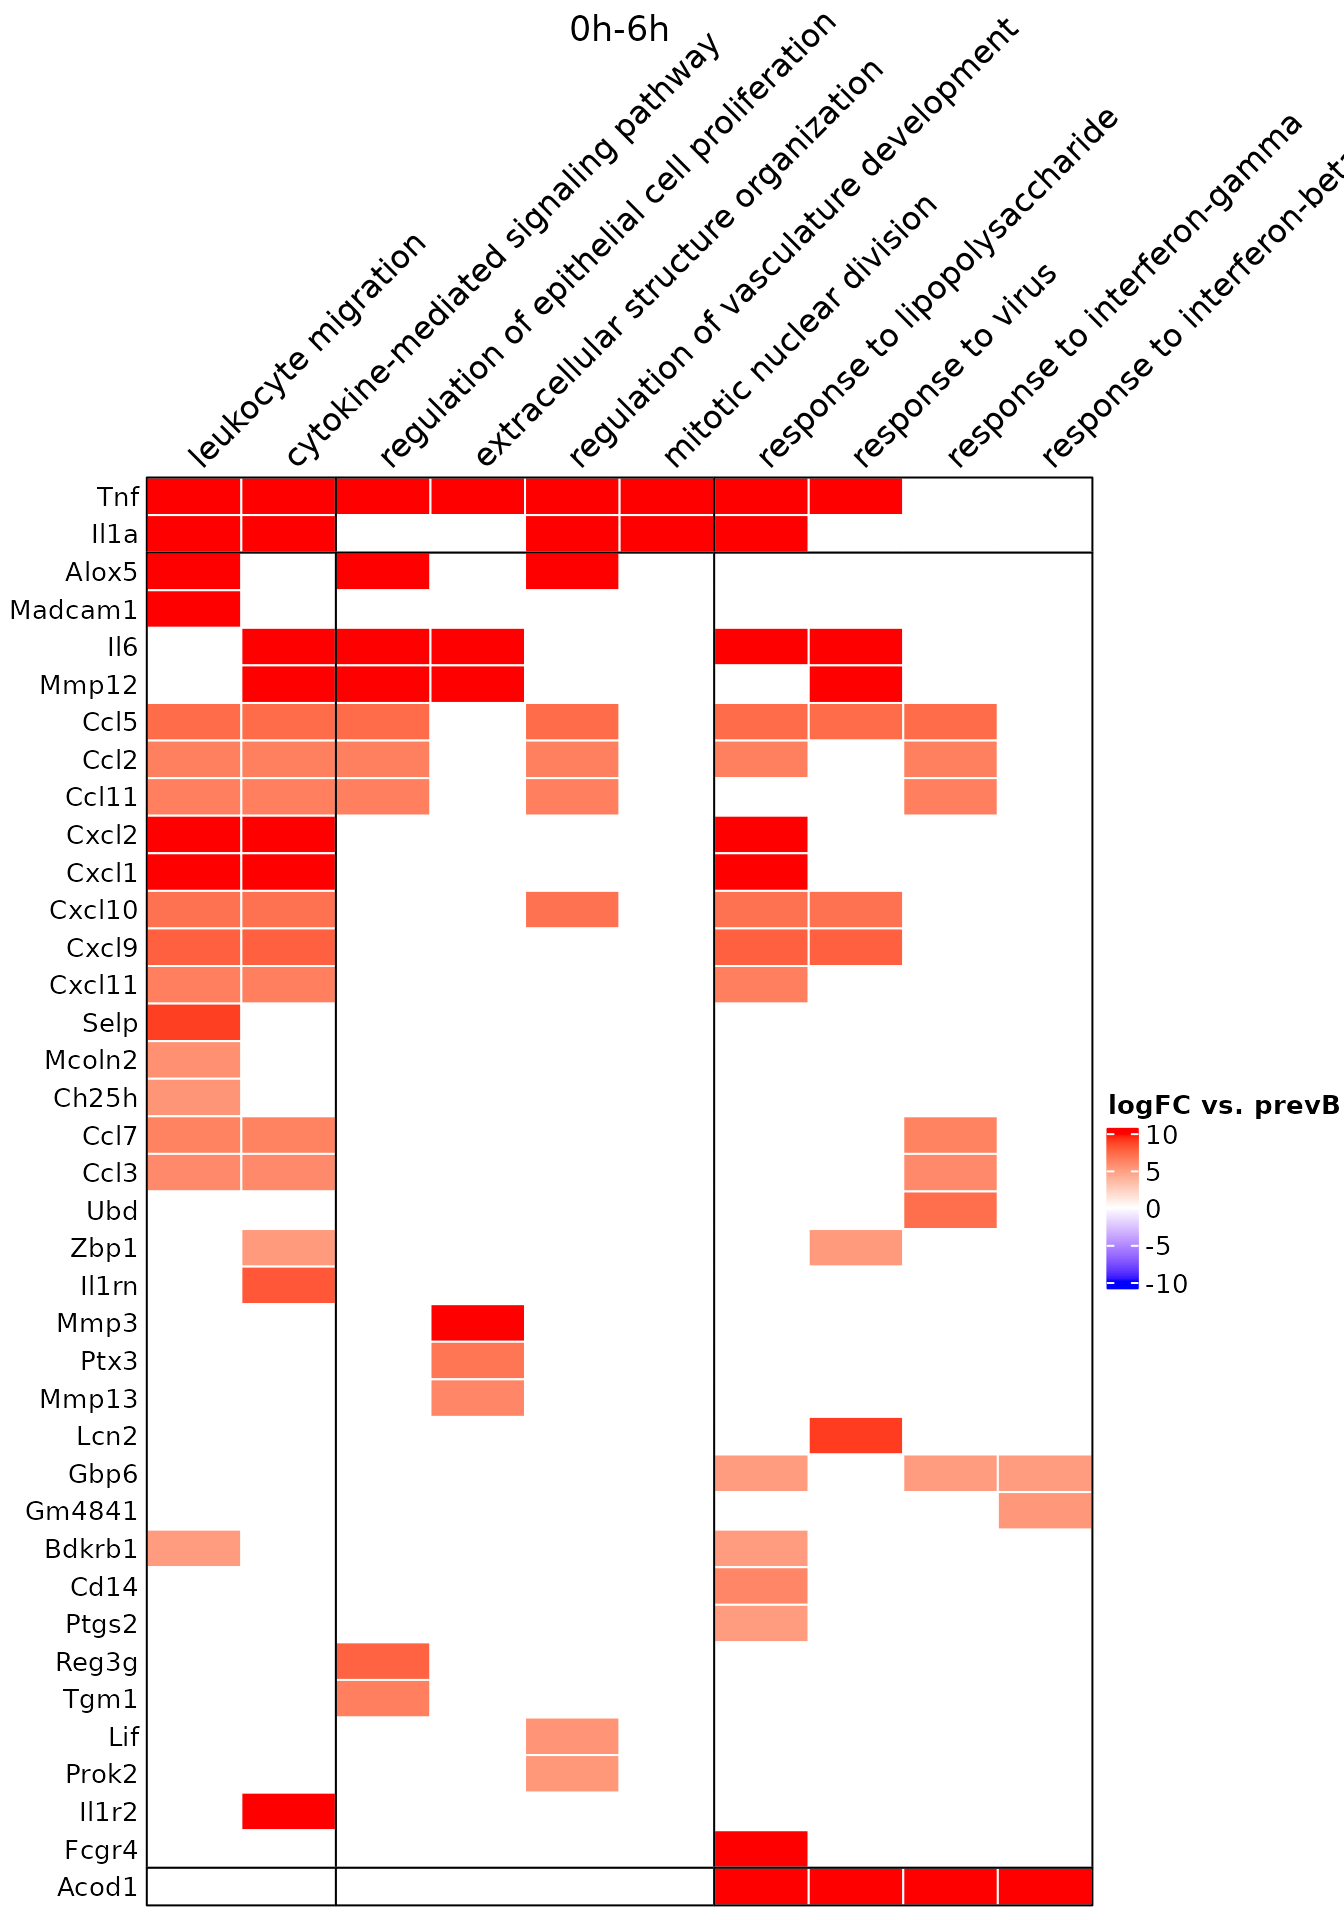
The data.frame gene.GO.df contains all the genes we found through TrendCatcher without logFC threshold.
- type, activation pathway or deactivation pathway.
- Description, GO term.
- gene, gene symbol or gene ensembl.
- logFC.prev.bk, logFC compared to previous break point.
- prev.bk.t, previous break point time.
- Symbol, gene symbol.
- description, gene description.
head(gene.GO.df$GOheatmapDat)## type Description gene logFC.prev.bk prev.bk.t
## 1 Activation cytokine-mediated signaling pathway Ccl3 5.951150 0
## 2 Activation cytokine-mediated signaling pathway Ccl11 6.495073 0
## 3 Activation cytokine-mediated signaling pathway Tnf 32.479065 0
## 4 Activation cytokine-mediated signaling pathway Il6 10.157610 0
## 5 Activation cytokine-mediated signaling pathway Il1r2 32.384983 0
## 6 Activation cytokine-mediated signaling pathway Il1rn 8.137336 0
## Symbol
## 1 Ccl3
## 2 Ccl11
## 3 Tnf
## 4 Il6
## 5 Il1r2
## 6 Il1rn